Memo: Best Practices to Increase State Education Data Transparency
August 31, 2020 | Download PDF
Over the last twenty years, GreatSchools.org has helped families, policymakers, and community leaders across the nation access and improve pathways to student success by sharing vital school information and free educational resources. Crucial to this effort is our ongoing process of advocating for and publishing more meaningful school-level data. As part of this process, we partner with states to improve how we use data to build public understanding of education and create viable accountability feedback loops that include all stakeholders.
In 2018, we took advantage of newly available school-level data that a number of states had begun to collect, which shed light on how well high schools were supporting their students’ postsecondary success. These measurements included college enrollment, persistence and remediation data. For the past three years, we have published this data and used it to identify and celebrate successful high schools as part of our data-driven College Success Awards. We are deeply grateful for the work you have done in your own agency to respond to our requests, share this important data, and to ask and answer questions about how we might use it to highlight high schools that are preparing all students for college success.
The dozens of state agencies we have worked with to acquire this data, including your own, have played critical roles in innovating ways to implement accountable practices. Reflecting the distributed governance of our education system, each state employs its own data strategy and implementation, leading to a wide array of data types, delivery mechanisms and accountability frameworks. Last year, we leveraged our bird’s-eye view of education data to survey the education data landscape in terms of its transparency and accessibility across a broad range of metrics. This effort led to a deeper analysis of how states can best leverage their data systems to improve public understanding and facilitate relevant accountability. The result of this analysis is this memo, which shares five best practices implemented by state agencies across the country. While the states cited in this memo1 did not all meet the threshold for participation in this year’s College Success Award, they offer valuable insights about the best ways to produce education data and make it available.
In 2019, GreatSchools.org published the first comprehensive report of its kind evaluating education data transparency by state. As we did in 2018 with our first College Success Award, we assessed states according to data availability and access, quality, and disaggregation across different data types.2 Our second transparency assessment seeks to uncover the organizational practices that can realize agency commitments to equity, accountability, and stakeholder engagement while improving workflow efficiencies.
The coronavirus pandemic and distance learning have heightened concerns around educational equity, among other barriers to student success. While acknowledging the undue pressure state systems currently face, we also recognize this to be a critical moment for your agency to better understand the student success pipeline. We know that adherence to best practices in normal times strengthens systems to withstand difficult times like those we currently face. As new patterns inevitably emerge for postsecondary pathways in the wake of the pandemic, data systems will help leaders understand new realities quickly. Reporting data will help policymakers move forward with funding and other decisions to recover from the crisis. We applaud your demonstrated commitment and continued efforts to partner with us for the students and schools in your state, and we urge you to consider the following recommendations adopted and practiced by your peer agencies nationwide.
Best Practice #1
Use unique identifiers to connect data and reporting across systems and at multiple levels
Under the Every Student Succeeds Act (ESSA), State Education Agencies (SEAs) nationwide have moved to align early childhood, K-12, and postsecondary readiness measures to better understand student outcomes in the education pipeline. However, monitoring longitudinal data across multiple data holders can be cumbersome if that data is collected and processed in isolated systems. A widely adopted fix to link databases has been the standardization of common variables, or identifiers, shared across the data ecosystem. For example, by using unique student-level identifiers, Georgia was able to trace postsecondary outcomes in college enrollment and persistence, and Oklahoma in college enrollment and remediation to high schools of origin. While many of these efforts focus on student-level linkages, states can also realize some of the benefits by applying the same approach at the level of schools, districts, and institutions of higher education. While it is common practice to link databases via shared variables, it is important to consider whether the identifying data is format-sensitive (i.e. date of birth, school/district name) or exclusive (i.e. Social Security number, NCES ID). Unique, format-neutral and universal identifiers can easily standardize data processes and streamline data sharing.
Best Practice #2
Formalize and give structure to interagency partnerships
Interagency collaboration is needed in order to assess the quality of schools and the impact of programs and policies. Where ESSA requires states to act on inequities at every level in the education system, it is critical that agencies be able to engage and coordinate with all relevant parties from the early childhood to postsecondary years. To simplify routine cooperation, it is best practice to formalize structures via cooperative agreements. Interagency agreements, such as memorandums of understanding (MOU), can establish accountability and provide consistency for processes and practices that extend beyond elected tenures. For instance, an MOU detailing provisions for collecting and disseminating annual data between the New Mexico Public Education and Higher Education Departments enabled the state to evaluate education program impacts for the last six years. In the absence of authority to mandate MOUs, non-binding agreements may be signed to formalize accountability and involvement. In Hawai‘i, the P-20 Partnership for Education – a statewide, cross-sector partnership led by the Executive Office on Early Learning, the Hawai’i Department of Education, and the University of Hawai’i System–was instituted via non-binding agreements to engage stakeholders in the state’s education pipeline.
Best Practice #3
Create methods to disaggregate the data
Measuring efficacy in an education system is difficult when data is combined and reported in aggregate. While summary data is helpful for providing a collective understanding of how students are being served, it can obscure important information about the experience of particular groups of students. Disaggregation, or the breaking down of data into different groups, can help administrators compare outcomes across those categories and more effectively allocate limited resources. Common group analyses include data by institution type, school year, and student group (race/ethnicity, socioeconomic status, grade, English proficiency, disability, etc.). Where ESSA requires states to equitably support all students, disaggregated student data can expose achievement gaps and allow for the design of tailored interventions. A common obstacle to breaking down the data, however, is small population counts. Yet, as Iowa demonstrates, there are ways for SEAs to disaggregate education data while protecting student privacy. For instance, despite small annual student counts at the school level, Iowa addressed this concern by combining college remediation data across three years to increase group sizes.
Best Practice #4
Employ consistent metrics and measures over time
An important aspect of data quality and utility is data consistency—the common variables shared across data collections over time. Greater consistency can help create a controlled baseline to monitor growth and/or progress, and increase data utility, i.e. enabling trend analysis. While many states demonstrate consistency for graduation and SAT/ACT performance data, Vermont is among the few that have also consistently reported on college enrollment and persistence variables since 2008. Missouri has consistently reported on college persistence and retention as far back as the 1990s.
Best Practice #5
Organize and present the data in a centralized, concise, and easy-to-follow way
Given the stratified nature of the education data collected, it becomes difficult to simplify data presentation. However, as best practices from Arkansas, Colorado, Louisiana, and Illinois demonstrate, user-friendliness can be described with three main principles:
- Ease of access – Report all data through a single portal. While it may appear more presentable to differentiate the data by theme, data separation can complicate usability and lower data utility. Illinois models straightforward data organization, presenting all data types in a single data set differentiated only by school year.
- Ease of comprehension – Clearly identify and describe what can be found where. Identifying markers in file names and descriptions, such as by year and metrics, provide sorting tools and increase ease-of-access and utility in the user experience. For instance, Louisiana presents clear and concise descriptions of dataset dimensions (summary or subgroup) and content (year, data type(s), etc.) in an ordered list.
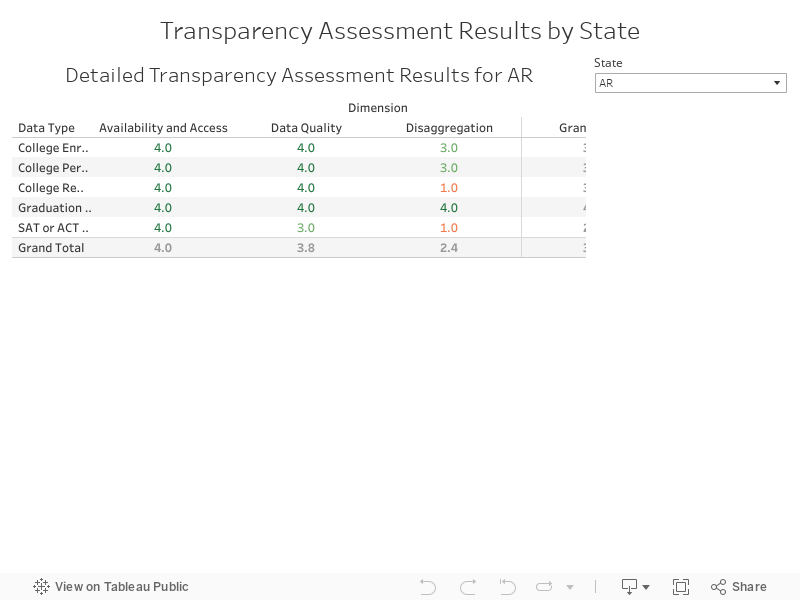
- Ease of use – Dashboards that visualize data where possible can increase user interaction and understanding. For instance, Colorado publishes an interactive report that gives users a visual , interactive overview of the data without having to access the data files. Options to easily download files provide alternative ways to increase functionality. The Arkansas dashboard not only gives users the flexibility to graph, map, and compare different school and district data, but also provides ways to download figures and data in different formats.
Data transparency is not just an investment in the future. It’s an investment in the present. The need for fiscally responsible and effective decisions is at an all-time high. We urge you to consider these best practices and activate the tools and benefits that accompany increased state education data transparency. Please reach out to learn more about our education data transparency assessment work; we look forward to partnering with you to help steward successful outcomes for all students.
1 Arkansas, Colorado, Georgia, Hawaii, Illinois, Iowa, Louisiana, Missouri, New Mexico, Oklahoma, Vermont.
2 However, the first report also measured test scores and student growth in addition to the five variables described in footnote 1. For more on the 2019 assessment, see the published report here and descriptions of the methodology in the appendix.
Appendix
Transparency Assessment Methodology
We assessed states across three dimensions for each of the five measures, on a scale from “Poor” to “Excellent.” We translated these grades into scores to quantify a state’s transparency score.
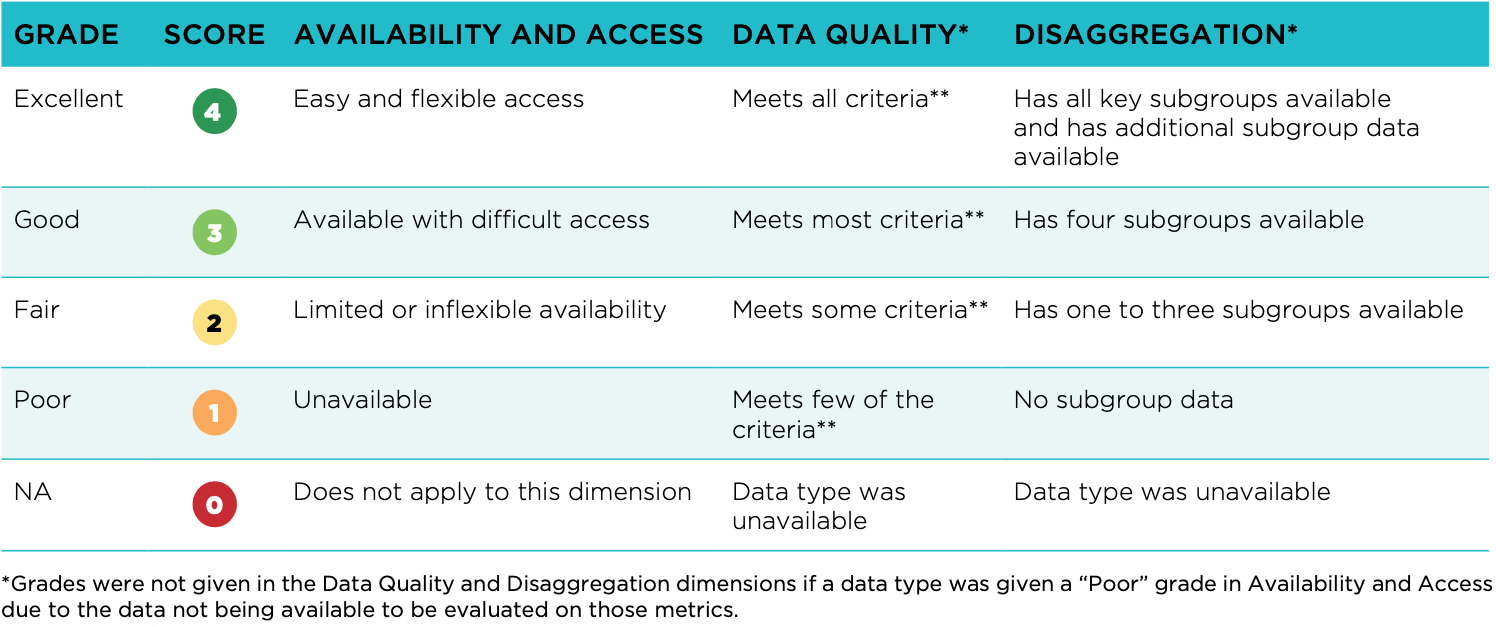
States with “Excellent” grades across all three dimensions would earn the maximum score of 12 points for a given data type. The lowest score a state could earn for a given data type is one point. That is, for data types that were unavailable, states earned a “Poor” grade or one for Availability and Access, and an “NA” grade or zero score for the Data Quality and Disaggregation dimensions. For this assessment, we included the Disaggregation dimension as part of the overall transparency score. We did not assess states separately on a combined score of only their Availability and Access and Data Quality dimensions. We did not consider data completely transparent without the potential to apply an equity lens to the data.
While in Year 1 we focused on transparency across several data types including test scores and student growth, in Year 2, we focused on highlighting states with best practices in reporting data that enables analysis and understanding of college readiness and college success for PK-12 students. The data types included in the Year 2 transparency assessment include: 4-year cohort graduation rates, SAT and/or ACT performance data, college enrollment, college remediation, and college persistence. Because of the relative unavailability of data on job placement outcomes for K-12 students across the 50 states and Washington, D.C. after high school, this year’s assessment has chosen to not include data types relating to career technical or vocational training and job placement, although future iterations may expand to this data.
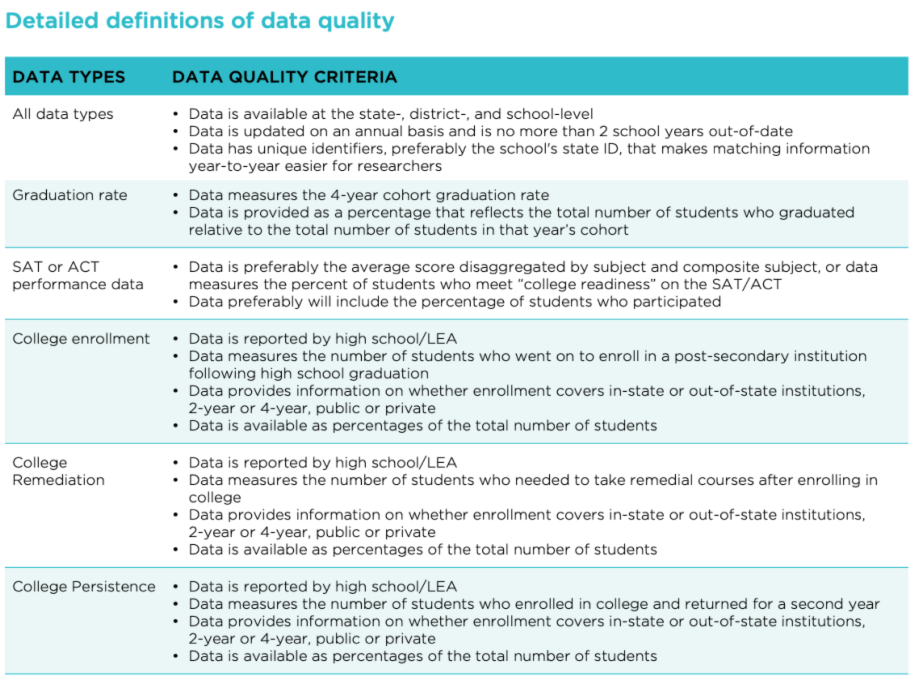
More detail on how we assessed data quality for each data type is below: