Find a great school.

Compare and choose.
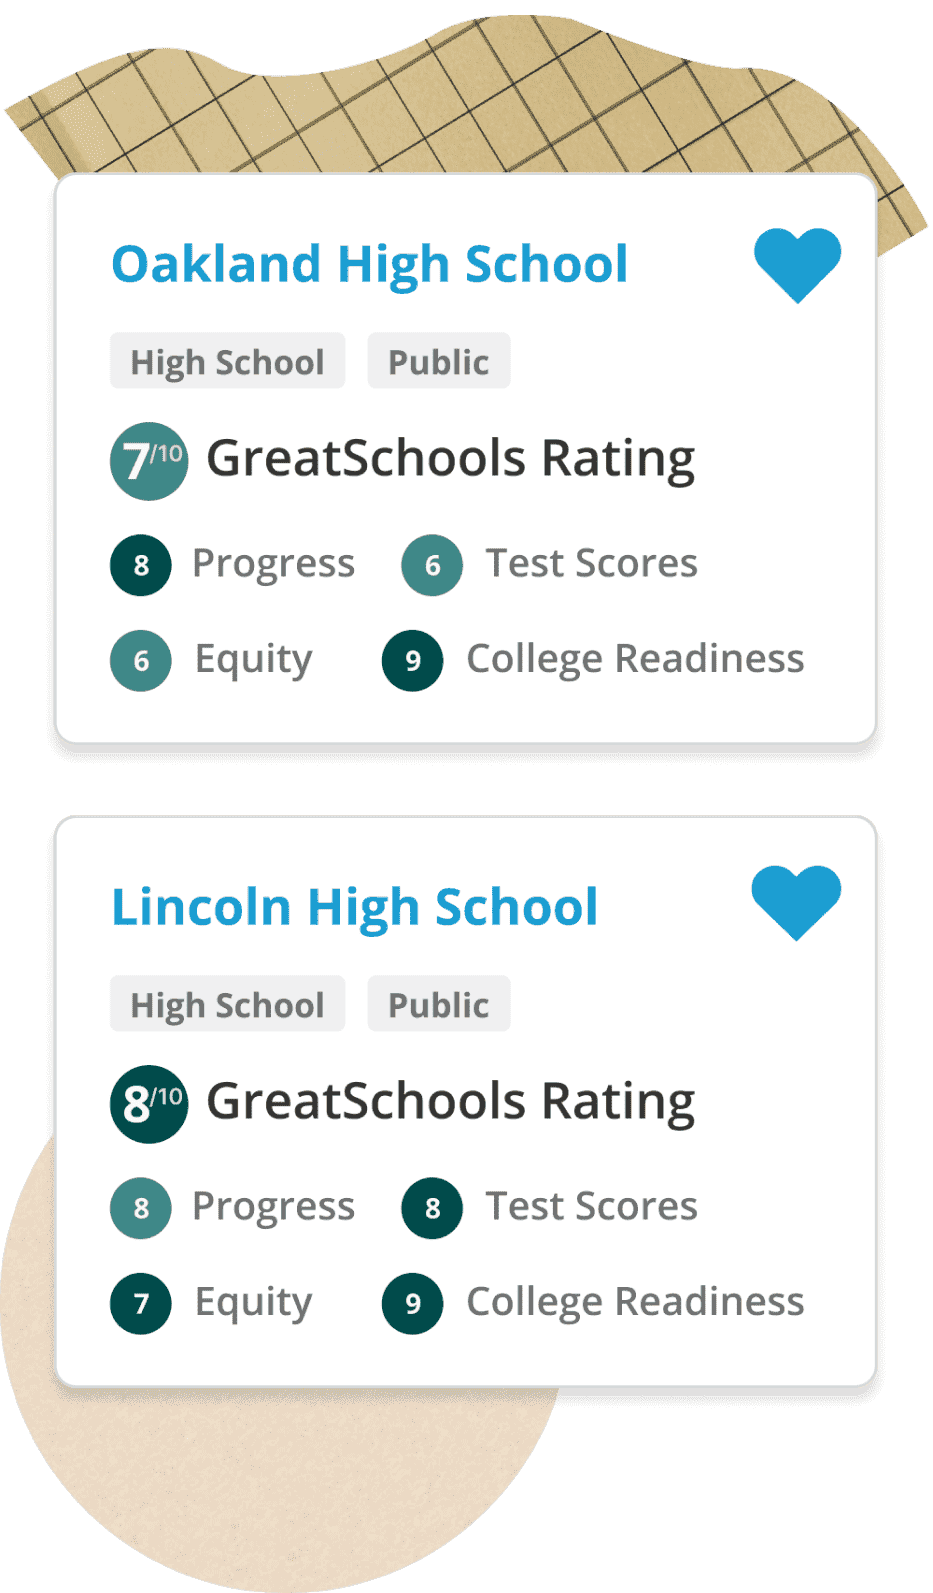
Create a list of your top schools to quickly compare and find the best fit.
Start my list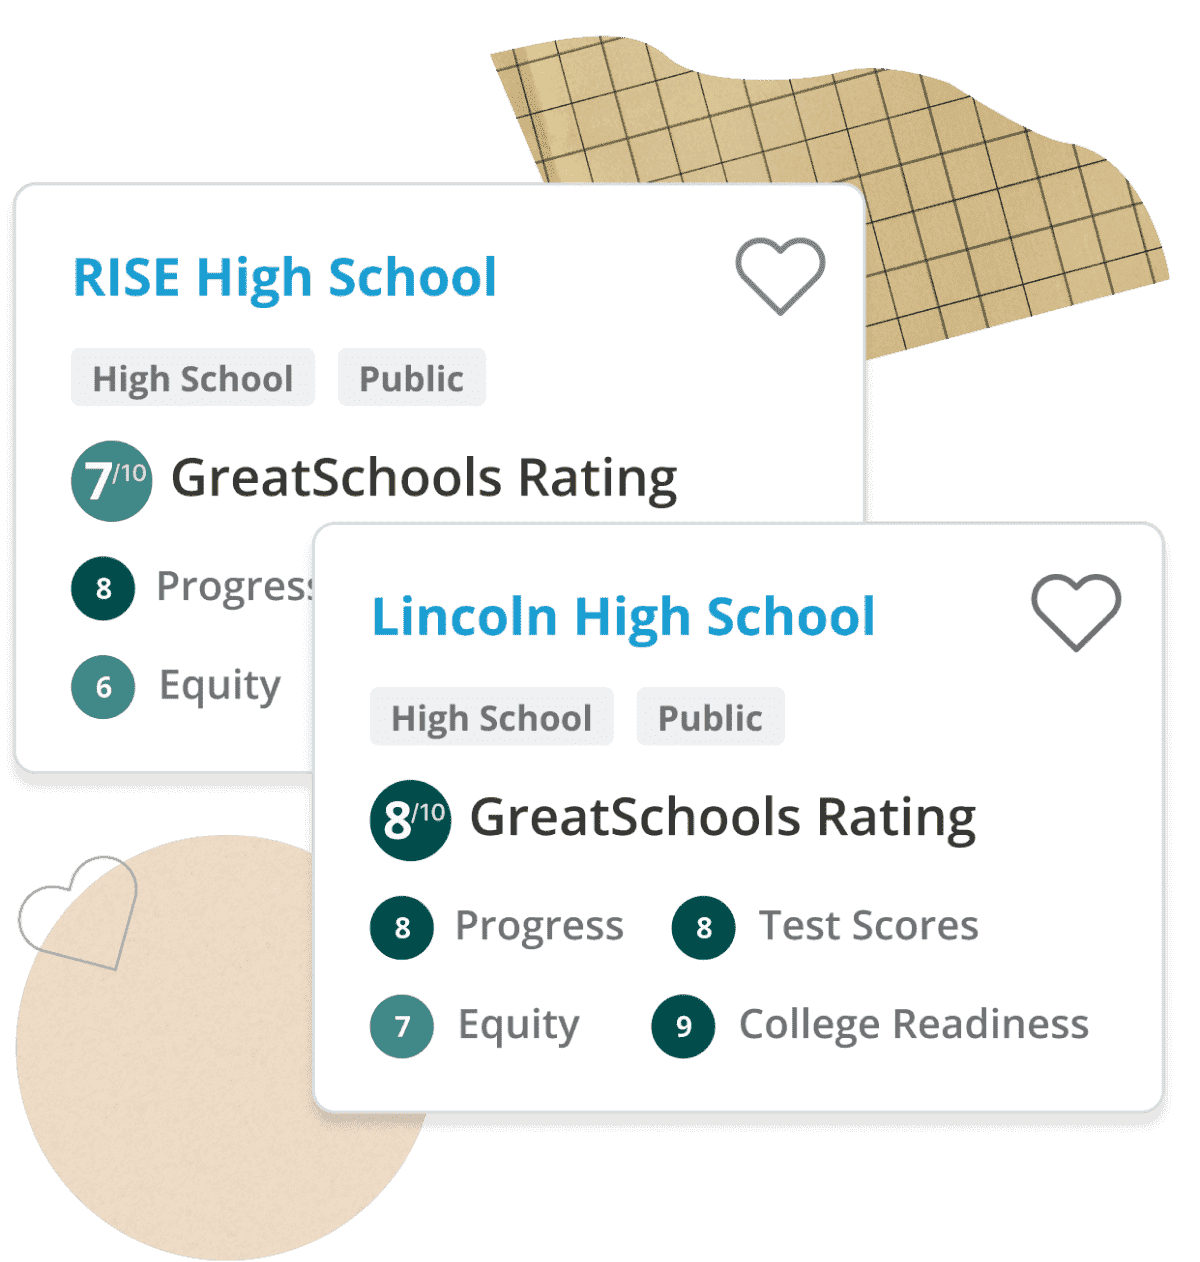
Share your experience.
Join over 200K people who help their school communities with reviews.
Review your school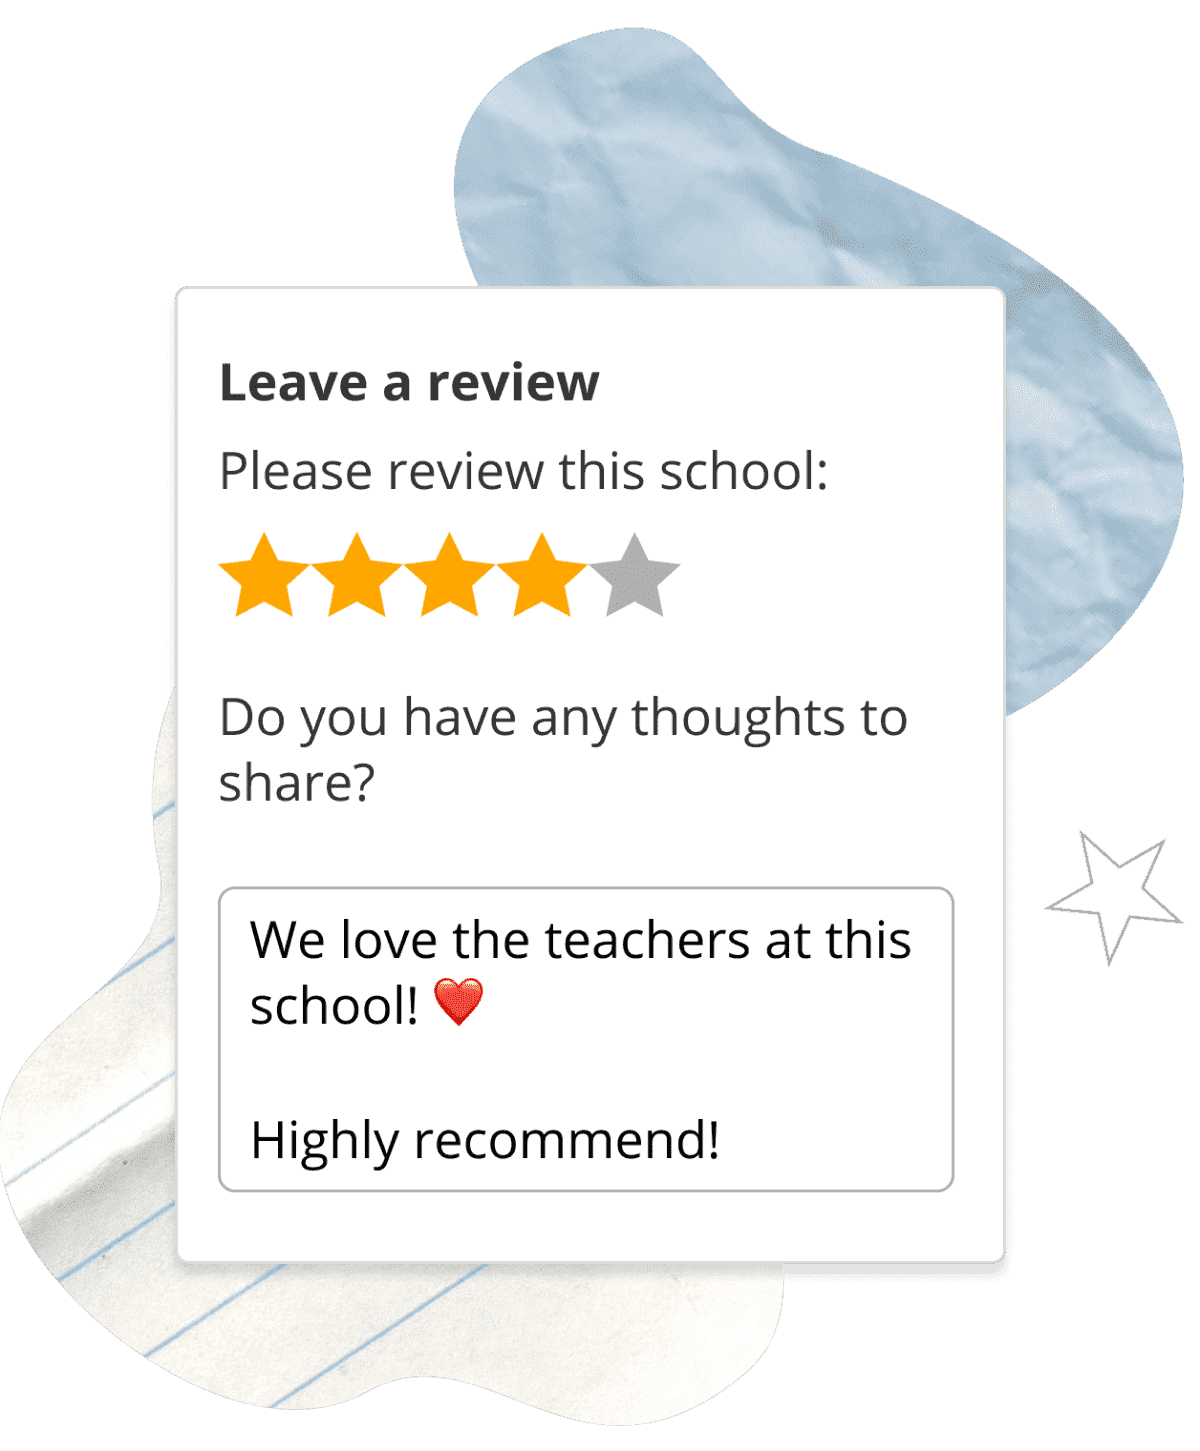
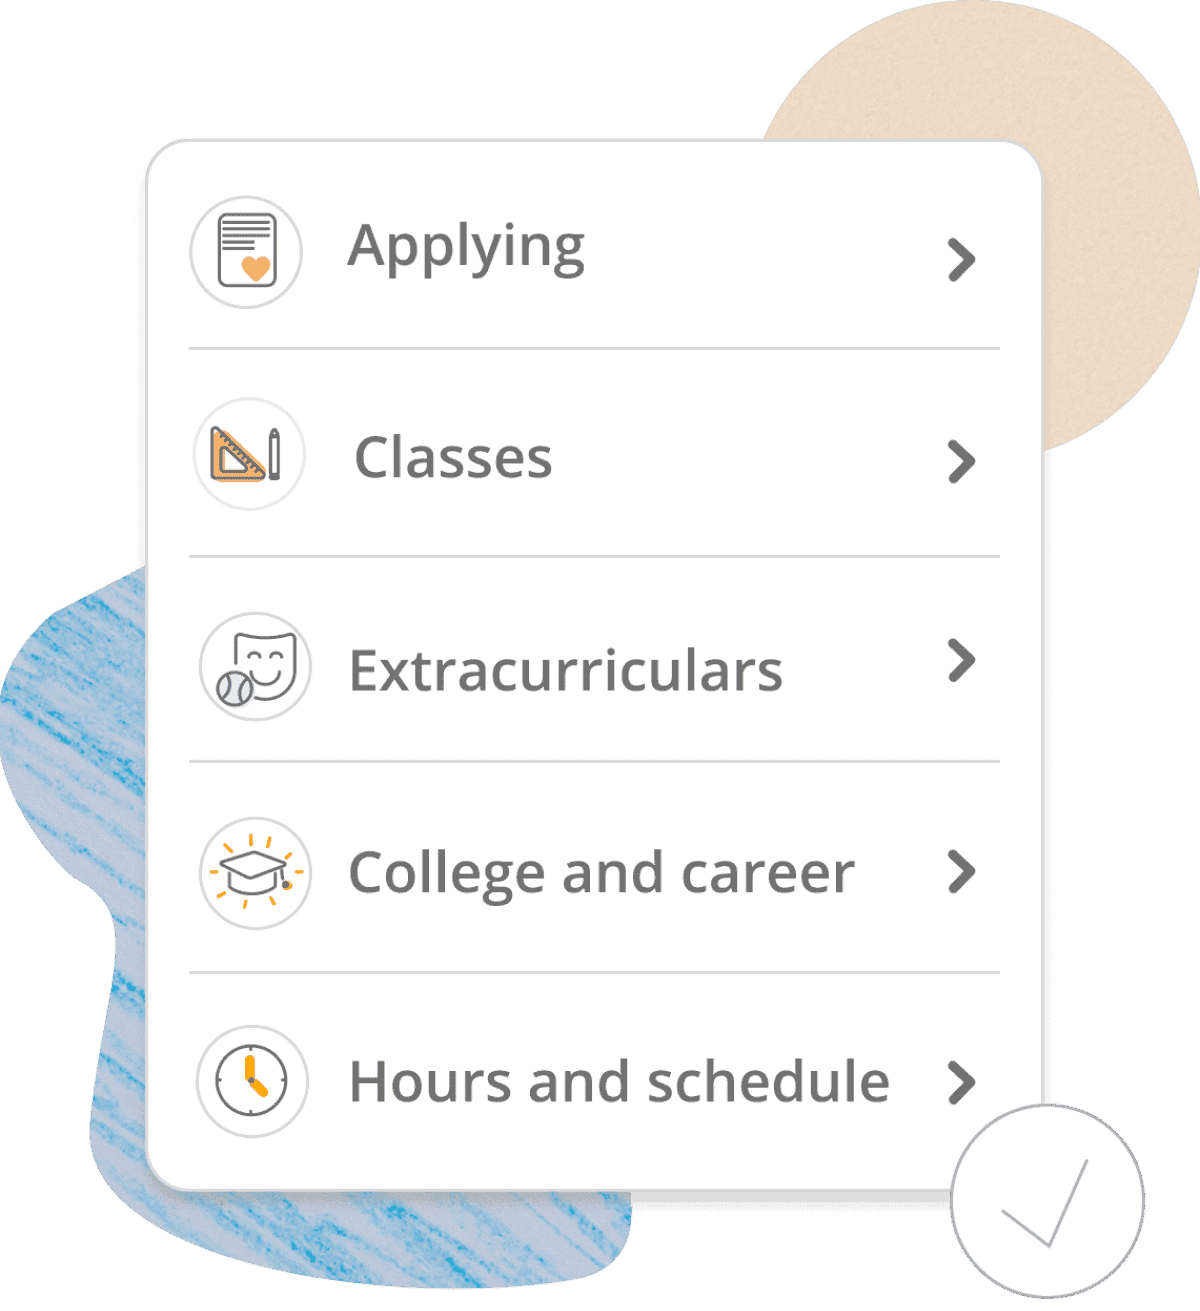
Get emails about your school.
Follow schools to receive email updates when new information is available.
Follow your school
Work at a school?
Claim your school to add and update information, link to your enrollment application, and reply to reviews.
Claim your school