

The old-fashioned way of learning about a school was simple: Talk to neighbors who’d sent their children there, find out who the good teachers were, then send the kids on their merry way. But now that school choice has become widespread in many cities, state and local governments provide an avalanche of school data. Those two factors are game-changing, especially for Black, Hispanic, and immigrant families who now have the chance to dissect reams of data about schools before even stepping on campus.
While many parents start school searches by focusing on high state test scores, it’s important that Black and Hispanic families consider additional signs of school quality. Why? Because test scores are highly correlated with family income, they don’t necessarily reflect a school’s true quality. What’s more, the history of tests being used as a tool of racial subjugation has left many families of color skeptical about the value of a school’s proficiency (or average test scores). Fortunately, proficiency rates are no longer the only widely available type of school information and so Black and Hispanic families can (and should) look at a wider array of information that may help them see how their child will experience the school. This includes anything from a survey about a school’s culture to data that reveals racial or ethnic bias in school operations.
Where can one find such information and how should parents weigh all the different data points? Keeping in mind that the pandemic meant that many schools couldn’t collect the data they usually do, here are a few things to keep in mind:
-
Look for the data about student growth, not student achievement
While some families may be attracted to high test scores in a school, Jamil Modaffari, a research associate on the K-12 policy team at the Center for American Progress says “Standardized test scores aren’t the most reliable indicator of school quality for any caregivers, not just Black or Hispanic families.” In rounds of interviews with parents of color, he noted that “Many of the caregivers we spoke to were more interested in student growth than pure achievement.”
Growth is a measure of how much students learn from year to year, especially in grades 3-8. A school may have very high test scores, but a lower rating for growth can mean that its students aren’t learning as much year to year. States use different ways to figure out student improvement, but the data is generally linked to state math and reading tests mandated by law. (Growth data is less widely available for high schools because in many states high school students only take state standardized tests in one year.)
Finding student growth data for a school is usually available on state department of education sites, and is often broken down among different ethnic groups and income levels, which can be particularly important information for families of color. Michigan, California, Connecticut, and Georgia, for example, are just four states that have traditionally made school or district growth rates easy to find. But because the pandemic disrupted testing in many states, parents may have to make do with growth scores from 2019-2020 or earlier when choosing a school.
How to find growth data on GreatSchools.org: As the first rating in the Academics section of the school profile, GreatSchools offers a Student Progress rating or an Academic Progress rating for every public school.
-
Why attendance and discipline numbers matter
The importance of attendance data doesn’t need too much explanation. It’s obvious that if kids don’t show up at school, it’s a big red flag. Attendance can be an especially telling data point for families of color because you can see disparities between the attendance rates of different student groups.
Attendance data is available for schools, usually broken down by ethnic group, on the individual school report card each state issues. A school may have an overall high attendance rate, but if Black students have a very high rate of skipping school, it’s a sign that these students are probably not getting much from what the school has to offer and the school is not engaging them.
Similarly, overall suspension rates – also on those same school report cards – at a school may be low. But if the small number of Hispanic students are being suspended at ten times the rate of the white students, it’s a very bad sign. It may signal that school discipline practices are biased against certain groups of students. Harsher discipline for students of color can lead to lost learning, and in the worst cases, involvement with police and the courts.
High suspension rates are especially troubling if they show up in elementary schools. You can find a school’s suspensions and arrests (as well as other basic demographic data) by going to the site of the U.S. Civil Rights Data Collection and typing in the school’s name and address.
How to find attendance and suspension data on GreatSchools.org: Wherever data is available, GreatSchools.org offers attendance and suspension data in two places that enable you to see the school’s chronic absenteeism and suspension rates for different student groups. The first is in the Race/Ethnicity section under the “Discipline & attendance” tab. The second is in the Students With Disabilities section under the “Discipline & attendance” tab. GreatSchools.org also uses this information to create “red flags” for schools that have both high rates of suspensions or chronic absenteeism and large gaps between students of different ethnicities or races.
-
The value of school climate surveys
In many districts now, students, teachers, and parents are asked to fill out surveys about their schools. While this may sound subjective, most of these surveys have been designed by researchers based on the evidence of what actually helps kids learn and succeed. For instance, since research shows that schools have better outcomes when students feel challenged to think deeply about a subject, they may have questions that probe into this student experience.
“The best indicators are climate surveys filled out by the students, staff, and caregivers.” says Modaffari. How available these are will vary by district, but they can prove quite useful to parents of color. One Denver school, for instance, asked parents “How well does your child’s school value the diversity of children’s backgrounds?” About 70% of respondents had a positive answer to that question in 2017, 2018, and 2019—but in 2019 that was fourteen percentage points lower than the district average, which could be a red flag to Black and Hispanic parents.
About 6,000 schools in 22 states already participate in the 5Essentials survey, developed by the University of Chicago, which surveys teachers and students about five key climate factors: effective leaders, collaborative teachers, involved families, supportive environment, and ambitious instruction. Researchers have found that schools strong on at least three of these five essentials are 10 times more likely to improve student learning than schools weak on three or more of the five essentials. So ask any school you are considering if it gives this survey, and for the most recent results if it does.
Parent engagement and school climate surveys may take some digging to find, but can often be found in state (and sometimes local) department of education school reports. Each district will ask different questions. Do parents feel welcome at the school? Are kids bullied because of their sexual orientation? How safe do kids feel at school? How well do the teachers and principal get along? Those are the types of things families want to know.
How to find school climate data on GreatSchools.org: For schools in Illinois and New York City, GreatSchools displays the results of the 5Essentials survey in the School Improvement section. For the other states, our community reviews can offer insight into students’ individual experiences at a school.
-
The data on advanced coursework
Parents of older kids often want to know how many of their kid’s classmates in Advanced Placement, International Baccalaureate, or honors classes are Black, Hispanic, or English Language Learners. These are the students who have long been underrepresented in advanced classes. The U.S. Civil Rights Data Collection database provides information about how many students in a school take advanced courses. Not all districts, however, break this data down by ethnicity. “It’s not common to break down ethnicity in AP, IB, or dual [college] enrollment classes,” says Orville Jackson, vice president of Data Strategy at GreatSchools.
To find school districts that are working to make sure students of color are represented in Advanced Placement and other higher-level courses check this list of school districts working with nonprofit Equal Opportunity Schools, which seeks to boost the number of Black and Hispanic students in those classes. You can also look at a pre-pandemic map developed by ProPublica that lays out the areas of the country and some of the schools and districts where Black and Hispanic students were more likely to be enrolled in advanced classes.
How to find data on advanced course work at GreatSchools.org: GreatSchools high school profiles offer data about the percentage of students enrolling in advanced classes such as AP and IB classes (in College Prep and Advanced Courses) and which classes are offered (in Courses & Programs).
-
Environmental hazard is an overlooked data point
An important data point that Black and Hispanic families sometimes don’t think about is one for any environmental hazards near a school, which can affect learning as well as physical health. A large study in China, for instance, showed that student verbal test scores declined significantly over a three-year period in that country’s smoggy cities. Closer to home, while black children make up 16% of all US public school students, more than a quarter of them attend the schools worst affected by air pollution according to a 2018 study, with schools in New York, Chicago, Pittsburgh, and Jersey City, among the most affected.
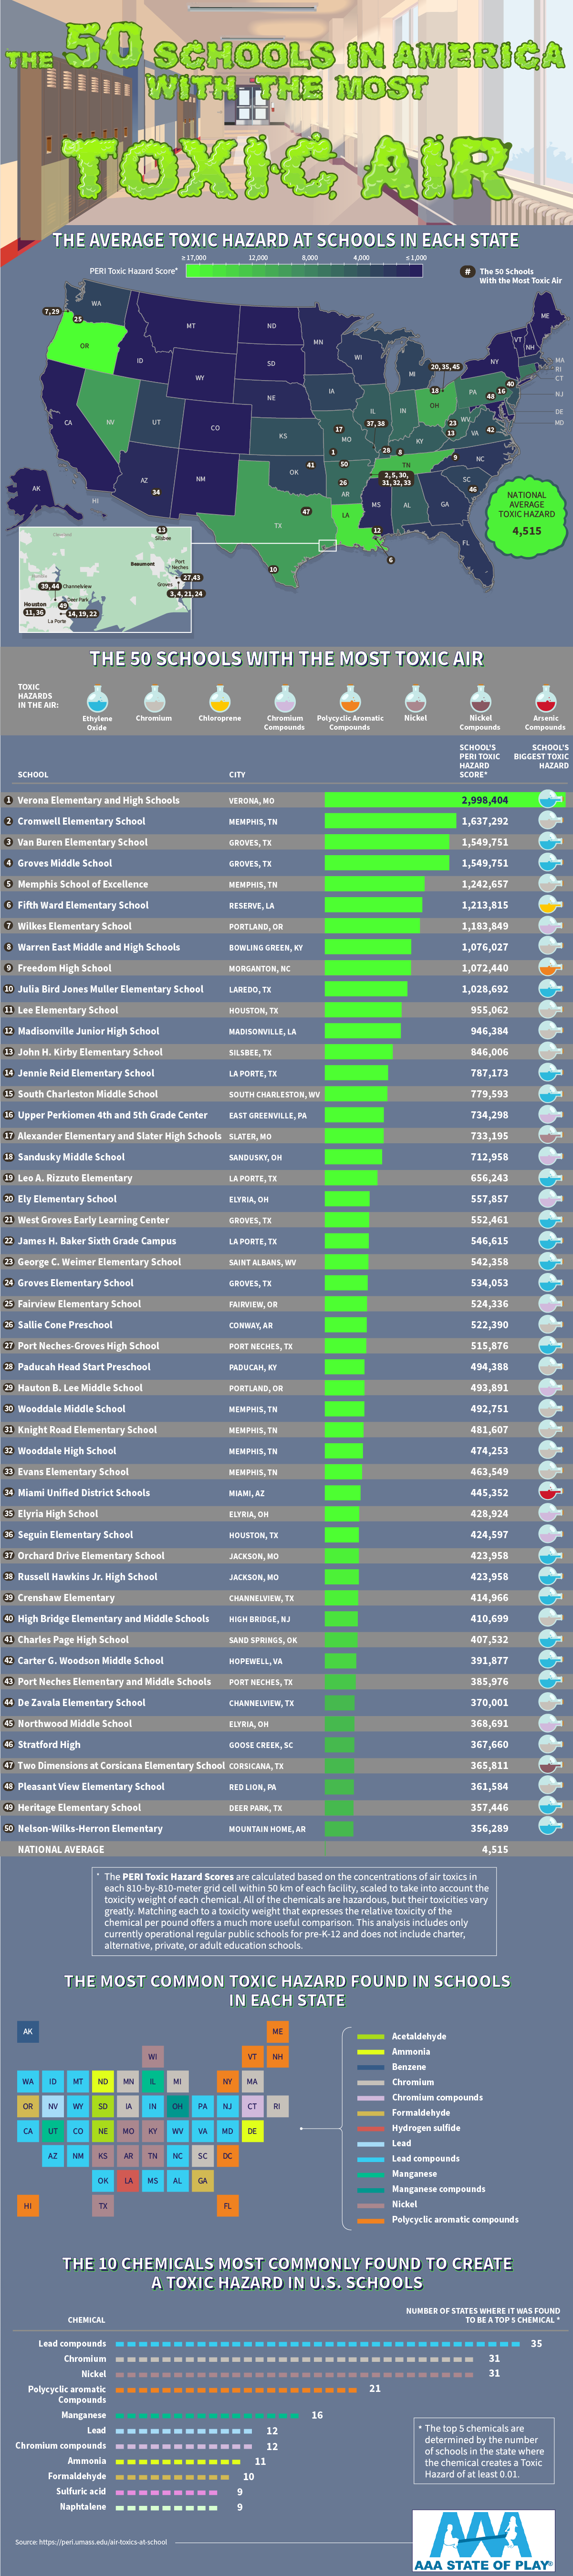
Schools in some rural areas have also been hard hit because they were built in undesirable areas–near mines, factories, refineries, airports, or toxic landfills, for instance. In this list of 50 schools subject to the most toxic air, many fit that category. Moreover, in 35 states, school children also had elevated chances of being exposed to lead, which is known to hamper intellectual development.
Unfortunately, there is no central repository of data that details all environmental hazards at all schools. So parents must investigate potential dangers–lead paint, air pollution, mold, tainted drinking water, asbestos, and the like–school by school. The U.S. Environmental Protection Agency has general guides for what schools should do to ensure the health and safety of their communities. But specific regulations about environmental safety often fall under state or local law. The nonprofit Public Employees for Environmental Responsibility lists some of the school districts with the most serious environmental issues.
Using GreatSchools data
You can find much of the data about public schools on your own. But GreatSchools incorporates a lot of what’s publicly available in its school ratings. Here are a few tips to avoid misunderstanding what some of these ratings mean, and which ones might prove most useful.
- The Summary Rating we give to schools can be misunderstood because parents can see a number on the ‘1’ to ‘10’ scale and view it like school grading, where a ‘6’ would be a ‘D’ while a ‘9’ would be the equivalent of an ‘A’. Nope. Our Summary Ratings are such that a ‘5’ is an average rating.
- When we rate a school, the greatest weight is given to its growth scores. We are updating our growth ratings with 2022 test results as they become available. A ‘5’ means that kids are progressing academically at the average rate for the state. When states do not provide the growth or test data for a Growth Score we develop our own Academic Progress rating for the school.
- Black and Hispanic parents should especially know that our Summary Rating covers the school as a whole and not individual programs within it. That’s important for those who would dismiss a school with a ‘4’ Summary Rating, but don’t realize that while the school might have a large dreary general education program, it may also host an honors section, vocational or career education specialties, an International Baccalaureate track, special arts programs, or maybe Junior ROTC–any of which could be a good choice. It isn’t unusual anymore for high schools to have a mix of high- and low-performing programs under one roof.
- GreatSchools’ Equity Overview rating (also on a ‘1’ to ‘10’ scale) will be of great interest to Black, Hispanic, and immigrant families. This rating consolidates much of the available data on how these students are doing at a school and considers how well the school serves disadvantaged and underserved students–compared to other schools in the state–based on college readiness metrics, student progress, and test scores.
Statistics can never tell you everything you want to know about where to enroll your child. It’s still helpful to google any news about a school, visit it to see for yourself and ask questions, and yes, talk to the neighbors who’ve sent their kids there. Knowing the numbers about a school is not the be-all and end-all. But it is a good place to start.


