GreatSchools Ratings Methodology Report
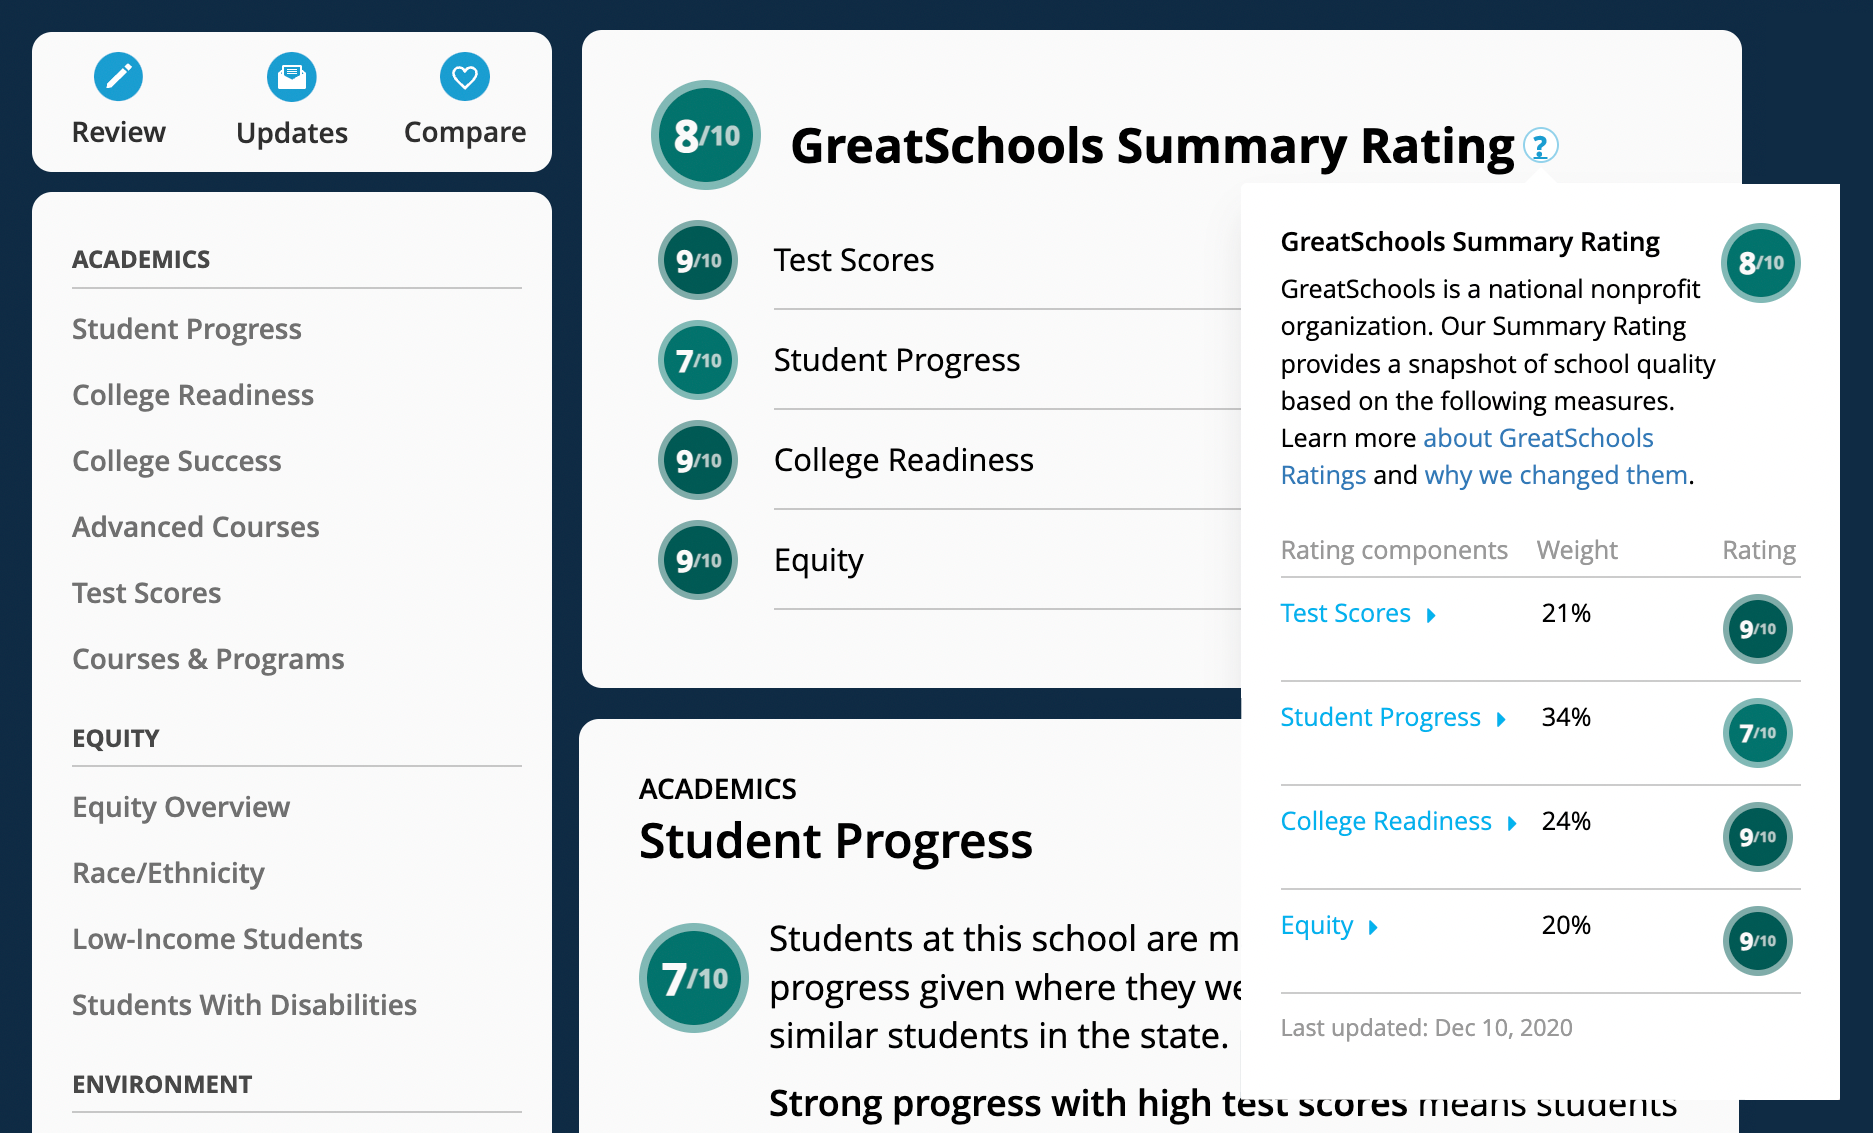
Summary Rating
The Summary Rating is a multi-measure school quality metric intended to reflect how well a school is preparing students for postsecondary success. The Summary Rating is an aggregation of a school’s Themed ratings, including Student Progress or Academic Progress, College Readiness, Equity, and Test Scores.
Themed Ratings
GreatSchools currently produces four themed ratings, all of which are included in the Summary Rating when available. The Student Progress Rating is calculated using state-level student growth data. This rating is replaced with the Academic Progress Rating (a proxy growth measure created by GreatSchools) when sufficient state-produced student growth data is not available. The College Readiness Rating is a multi-measure rating based on high school graduation rate data, college entrance exams (SAT and ACT), participation in advanced courses (Advanced Placement (AP), International Baccalaureate (IB), or Dual Enrollment) and AP exam data. The Equity Rating incorporates multiple student outcome measures for historically disadvantaged students including state test scores, academic growth, college entrance exam performance, and high school graduation rates. The Test Score Rating is based on student performance data gathered at the state level. Each separate themed rating reflects a different dimension of school quality and provides distinct value to a school’s Summary Rating.
The Summary Rating is constructed in a two-step weighted average approach. The first step is to establish “base weights” for each themed rating, based on research linking the indicators measured to postsecondary success and GreatSchools’ mission to support educational equity for students from disadvantaged backgrounds. The second step is to estimate “information weights” for each component that indicate the amount of information in the underlying data for each school. These information weights for each rating are capped at the maximum information weight of the Student Progress Rating to control for large variations in weights between ratings, and so as not to overwhelm the influence of growth data. If the state does not provide Student Growth data then the information weights for each themed rating are capped at the maximum information weight of the Academic Progress Rating. The resulting weights are rebalanced in cases of missing components to calculate the final weighting structure.
Base Weights
The initial base weights for each themed rating are based on their overall importance relative to research on the association between measures included in each themed rating and postsecondary outcomes and GreatSchools’ mission. For each themed rating, we reviewed research that analyzed the relationship between themed rating inputs and postsecondary or later life outcomes, including college and university enrollment, matriculation, remediation, and the like, as well as incarceration, and wage outcomes where possible. We also sought expert advice from external researchers in order to balance the existing research findings with the importance of highlighting newer, potentially more valid measures (such as growth), where the evidence base is still being built.
For each of the themed rating inputs in our meta-analysis, we used a 1–5 scale to indicate the importance of that measure. The 1–5 scale is cardinal, not ordinal, meaning that every input could potentially receive a ‘5’ if our research and valuation process recommend greater weights for all inputs. For themed ratings that consist of multiple different data inputs, the strength measures of the individual inputs were combined and averaged using the same method of aggregation as in the construction of the themed rating.
Our studies found evidence of relationships connecting postsecondary and later life outcomes with all data inputs. A mounting body of research suggests that student growth is a more accurate measure of the value that a school adds for its students, leading to a strength score of 5 for the Student Progress and Academic Progress Ratings. In some states, student growth data is not made publicly available. In these cases, the student growth portion (Student Progress) is replaced with GreatSchools’ Academic Progress Rating. Although research points to the correlation between traditional proficiency metrics and a variety of outcomes, these measures are also strongly correlated with student backgrounds and may tell us more about the students’ origins than the impact of the school itself, leading to a strength score of 3 for the Test Score Rating. The College Readiness Ratings are also based on inputs strongly linked to both positive postsecondary outcomes and students’ family backgrounds. leading to an aggregated score of 3 for the themed rating. The strength score for the Equity Rating was also set at 3 to indicate that the Equity Rating is composed of multiple inputs, and that ensuring equal outcomes for all students is equally as important as test scores and college readiness measures. To convert the strength scores into base weights, each score was divided by the sum of all themed rating scores.
Information Value Weights
The Summary Rating contains up to four themed ratings that are based on data gathered from state departments of education. Due to differences in assessments, policies, and other factors, the amount of data used in computing a given themed rating will vary. To correct for this variance, the weight of a themed rating increases relative to the number of data inputs it contains, but with a cap to keep individual ratings calculated from many data inputs from overriding the selected base weights. The cap is set so that no other themed rating’s weight can be greater than the weight of the Student Progress Rating. If a state uses the Academic Progress Rating in place of Student Progress, then the weights are capped at the Academic Progress Rating weight.
The definition of data inputs differs for each themed rating. College Readiness is based on an aggregation of multiple data inputs including graduation rates, College Entrance Exam data, and advanced course data. The Equity Rating is similarly compiled from multiple types of student outcomes metrics. Each of these data elements is considered an input taken into account by the information weights. For test scores, each grade/subject test used to compute a school’s Test Score Rating is an input. Most states produce growth data pre-aggregated to the school-level (meaning this would be considered a singular data input); although occasionally data at the grade/subject level is available. When this data is available each grade/subject with growth reported is considered an input, similar to the Test Score Rating. To control for the differences in data input granularity across themed ratings, the number of data inputs are converted into a percentile assessing the relative position of each school in the distribution of data inputs for each themed rating. This approach means that the measure of the amount of data contained in a given themed rating for a particular school is relative to the amount of data in that same themed rating for all other schools in the state.
In addition to the amount of data being leveraged by each themed rating, the amount of variability contained in each data point impacts the themed rating weights. Data points coming from distributions with higher degrees of variation provide a greater ability to differentiate schools from one another.
The information weight for a themed rating is based on both the amount of data inputs underlying the themed rating and the amount of variation contained in that data. We calculate the amount of data inputs for each school as a percentile for the particular themed rating. For themed ratings with no variation in the number of data inputs, the school’s percentile is imputed as the average across distributions of the count of data inputs for all themed ratings in the state. The amount of variation is calculated by taking the average standard deviation across distributions and scaling this measure of variation by the range of the distributions to arrive at a unitless measure of variance as the proportion of the total range of a distribution within one standard deviation for a given school. The two values are multiplied to calculate the information weight such that the percentile of the count of data inputs is scaled by a unitless measure of variance.
Combining Base Weights and Information Weights
Baseline weights adjusted for information value are considered relative weightings that are then rebalanced to sum to one, taking into account missing data. This is done by considering each individual weight in proportion to the sum of all existing weights. The final weight for each themed rating is calculated at the school level by adding the base weight and the information weight and dividing by the sum of the base weights for all themed ratings.
The Summary Rating is then calculated by multiplying each themed rating by its weight and combining. All values are rounded to the nearest integer so that all possible Summary Ratings are 1 – 10.
Exemptions and Missing Data
In order to receive a Summary Rating, a school must have either: at least two themed ratings, or a College Readiness Rating (this is because the College Readiness Rating is a multi-measure rating based on data from multiple sources not already present in other themed ratings.) Any school that does not meet these criteria does not receive a Summary Rating.
Student Progress Rating
The GreatSchools Student Progress Rating is a measure of school quality that uses state student growth data to attempt to control for factors not directly influenced by school performance, such as socioeconomics. Student growth models vary considerably by state but attempt to answer the same basic question: How much academic progress are students making at a particular school? Specifically, how much academic progress are students making relative to similar students in the state? The student growth data used by GreatSchools to produce our Student Progress Rating comes from state departments of education and are the results of each state’s own student growth model.1
While student growth models vary, the same methodology is used to rate all types of continuous growth metrics (e.g., student growth percentiles, value-added scores, net growth). First, we find the position of each school in the distribution of student growth scores in each grade/subject as a percentile. Each percentile is calculated by comparing a school’s student growth score for each grade/subject (eg. 4th grade Math, 10th grade Science) to the distribution of student growth scores from all other schools in the state on that same grade/subject test. We then average across all available percentiles for each school yielding an average percentile ranking for a school’s growth across grades and subjects.2
Once we have this average percentile, we assign schools a 1-10 value, with averages between the 1st and 9th percentiles receiving a “1”, those between the 10th and 19th percentiles receiving a “2”, and so on until schools averaging between the 90th and 99th percentiles, which receive a “10”.
1 For more information about your state’s specific Student Growth model, check your state department of education website.
2 Previous iterations of the Growth Rating methodology averaged growth metrics over two years, when available. While using a multi-year average for any metric reduces its volatility, the analysis does not conclude that the Growth Rating is particularly volatile. A simulation of one- and two-year Growth Ratings for Georgia found that 90% of schools’ one-year Growth Ratings were within 2 ± of their two-year Growth Rating.
Academic Progress Rating
In states that do not provide publicly available growth data which meets our requirements for a growth rating, we create a school value-added estimate as a proxy measure for growth using a value-added approach with school-level data. This approach creates an estimate of expected proficiency rates for each grade/subject in each school based upon the various qualities of the school, including the proficiency of students at that school in the same subject in the prior grade and previous year and the demographics of the students at the school. We then create a measure of distance from this expected value for each grade/subject at a school and find the position of each school in the distribution of these “distance from expected” scores in each grade/subject as a percentile. Each percentile is calculated by comparing a school’s “distance from expected” score for each grade/subject (e.g., 4th grade Math, 10th grade Science) to the distribution of “distance from expected” scores from all other schools in the state on that same grade/subject test. We then average across all available percentiles for each school yielding an average percentile ranking for a school’s growth across grades and subjects.
Once we have this average percentile, we assign schools a 1-10 value, with averages between the 1st and 9th percentiles receiving a “1”, those between the 10th and 19th percentiles receiving a “2”, and so on until schools averaging between the 90th and 99th percentiles, which receive a “10.”
The cancellation of standardized testing in 2020 and the partial resumption in 2021 has resulted in two years of nonexistent or, at best, incomplete data. Importantly, even in states with “high” participation rates, it is not always clear which student groups are represented. Research shows that the highest-need students often disappear from these data first — and they are also the ones who have suffered the most from pandemic learning disruptions. Because of this lapse in 2019-20 proficiency data and unreliable information from 2020-21, we cannot produce the Academic Progress measure using our standard prior-year methodology.
Instead, we instituted a temporary modification to our Academic Progress methodology to accommodate this two-year data gap. To measure school-level growth in 2022, we use 2021-22 proficiency scores and substitute 2018-19 school-level proficiency for the prior year’s test metric described above. The Regional Educational Laboratory Program (REL-Mid-Atlantic) recommends this solution to measure growth across the years of inconsistent testing.
College Readiness Rating
The GreatSchools College Readiness Rating is a measure of school quality focused on assessing the degree to which a school prepares students for entrance into postsecondary education. This rating process includes the computation of both overall school-level college readiness ratings as well as college readiness ratings for student groups within each school. This rating is comprised of three components:
- High school graduation
The high school graduation component includes the percent of students from a 4-year cohort who graduate from high school. Where available, this component will also include other high school graduation-related metrics. For example, the percent of graduates who meet University of California/California State University entrance requirements, is included in this component for California high schools. - College entrance exam
The college entrance exam component is calculated from the average performance for either the SAT or ACT. If a school or student group has participated in both the ACT and SAT, the score from the test with a higher rate of participation will be used. In the case where test-taking rates in the SAT and ACT are equal, values from the exam that is more commonly administered in the state are used. In states where either the SAT or ACT is mandated, the test-taking rate is not used. - Advanced courses
The advanced courses component is based on the rate of student enrollment in at least one advanced course, including Advanced Placement (AP), International Baccalaureate (IB), or Dual Enrollment courses (as reported in the Civil Rights Data Collection), and the rate of passing one or more AP exams. If a school does not offer advanced courses or the rates of participation are not provided, the rates of participation are assigned a zero (0).
School College Readiness Rating
The school College Readiness Rating is calculated in four steps outlined visually in Figure 1 below. First, each of the inputs available for a particular school is standardized. To do this, we compute the school’s position in the state-wide distribution of each metric as a percentile. Percentiles are calculated by comparing the values for each school’s performance on a particular metric to the state-wide distribution including all other schools in the state.
Next, within each component, an average of available metric percentiles is calculated resulting in a score for each of our three college readiness metric categories (high school graduation, college entrance exams, and advanced course participation).
Third, an average across the three components is taken. This approach ensures that equal weight is given to graduation rates, college entrance exams, and advanced courses when calculating a school’s college readiness rating. For schools with no available data in one of the components, the average across the other two components is taken. No combined average percentile is calculated for schools without data in at least two of the components, and these schools do not receive a college readiness rating.
Finally, the combined average percentiles are sorted low to high and converted into deciles. The bottom decile (1st–9th percentiles) of schools receive an overall rating of “1”, the second decile (10–19th percentile) receive a rating of “2”, and so on, with the top decile (90– 99th percentile) receiving a rating of “10”.
Figure 1: GreatSchools College Readiness Rating Process

3. Percent of Students Who Meet UC/CSU Entrance Requirements is a metric unique to California. Similar high school graduation-related metrics, where available, will be included here for other states.
Student Group Rating
College Readiness student group ratings are calculated using a similar process as overall ratings. Each metric is converted to a percentile, the percentiles are averaged within each component, and an average is taken across the components. Unlike the percentiles calculated for the overall rating however, student group metrics are converted to percentiles by comparing scores for a particular group to the scores for the overall population throughout the state. For example, a school’s AP Course Participation rate for Hispanic students is converted into a percentile by comparing that rate to the AP Course Participation for all students in schools across the state. This approach allows the student group ratings to reflect the differences between student groups within a school and those across the state.
After values are converted to percentiles, the percentiles are averaged within each component, and then an average across the components is taken. Unlike the process for the overall rating, the combined average percentiles are not sorted into deciles but instead are converted into ratings based on their value. Schools with a student group combined average percentile between 0 and 0.09 receive a rating of “1” for that group. Combined average percentiles between 0.1 and 0.19 result in a student group rating of “2,” and so on, with a combined average percentile between 0.9 and 1 resulting in a group rating of “10.” Because the student group ratings reflect a comparison to all students (and not a comparison to the student group), there will not be a uniform number of each rating.
Rating Exemptions and Adjustments for Missing Data
Ratings are calculated for each school and for each student group (Hispanic, Asian, etc.) within a school, where sufficient data is available. To calculate a rating for a school or group, data must be available for two of the three components, or no rating will be assigned. Additionally, schools designated as ‘Alternative’ by the Civil Rights Data Collection (CRDC) do not receive a rating and do not factor into other schools’ ratings.
If data from one of the metrics are only available for all students, and not disaggregated at the student group level, the data will still be used for calculating the overall rating. If non-disaggregated data results in an entire component not having data at the student group level, the combined average percentile for groups will be recalculated by comparing to a restricted combined average percentile for all students, which only consists of those components where student group data is available. For example, if college entrance exam data were not available for student groups, the combined average percentile for groups would be an average of only two components: the High School Graduation component and the Advanced Courses Component. Because the College Entrance Exam component would factor into the overall rating but not the student group rating, the ratings at the school-level could be very different depending on the college entrance exam performance. If a school’s college entrance exam metrics were well above average, that would increase the school’s overall rating but not their student group ratings, which would not be an accurate reflection of student group performance compared to overall performance. To correct this issue, a restricted combined average percentile for all students is calculated, which only includes the High School Graduation component and the Advanced Courses component. Each combined average percentile for student groups is recalculated by comparing it to the restricted version for all students. This process produces student group ratings that more accurately reflect the differences between overall and student group performance.
Equity Rating
The GreatSchools Equity Rating is a measure of a school’s success in serving disadvantaged students and in ensuring all student groups achieve similar levels of academic performance. Our Equity Rating now incorporates a broader set of student-outcome metrics in addition to proficiency scores (which tend to correlate strongly with race and income). In addition to proficiency scores, our new methodology includes college readiness metrics (e.g., college entrance exam performance, high school graduation rates), and measures of student- or academic-progress (growth or growth proxy). To evaluate a school’s success in educating disadvantaged students, our Equity Rating includes two components: the performance of disadvantaged students using multiple outcome measures and the relative size of in-school gaps between disadvantaged and advantaged students. The two components are computed and combined in a series of four steps: 1. Determining statewide disadvantaged groups, 2. Aggregating school performance across disadvantaged groups, 3. Calculating in-school gap weights, and 4. Computing the equity rating.
1. Determining statewide disadvantaged groups
When looking at equity in a broad sense, the Equity Rating specifically considers the overall performance of disadvantaged groups as well as the gaps between more advantaged student groups and disadvantaged student groups. A student group is classified as ‘disadvantaged’ or not by calculating average performance gaps between all groups and identifying those who face persistent gaps across all outcomes.
The first step to determining disadvantaged groups is to compare the performance of each group in a given school to the performance of all students in the state. For each outcome/grade/subject, the performance of students in each group at a school is compared to the distribution of performance of all students in the state for that outcome/grade/subject, locating where the performance of these students falls in the overall distribution as a percentile. Next, at the school/outcome/grade/subject level, the differences between percentiles are calculated between all pairs of groups. Across schools, these percentile differences are averaged at the outcome/grade/subject level to find the state average percentile differences between student group pairings at the outcome/grade/subject level. Then, these differences are averaged to find the average difference each group faces at the outcome/grade/subject level. Finally, the average difference for each group is calculated across outcome/grade/subject levels to find the average gap each student group faces across all schools and outcomes. The student groups for whom the average gap is negative are the disadvantaged groups for the purposes of the Equity Rating.
2. Aggregating school performance across disadvantaged groups
The core of the Equity Rating is the performance of disadvantaged groups at a school. To assess a school’s level of performance with a particular student group, all scores are converted to percentiles by comparing to the state distribution of scores for all students at the grade/subject level. For each disadvantaged group at each school making up at least 5% of student enrollment, an average is calculated of all these percentiles. These disadvantaged student group percentile scores are then averaged across groups to the school level to create an average disadvantaged group performance measure. For all student groups beyond the 5% threshold, all percentiles are equally weighted in a school’s average.
3. Calculating school gap weights
A school’s average percentile score for disadvantaged groups does not reveal whether or not in-school gaps in performance between student groups exist at the school. Adding a measure of in-school performance gaps to the Equity Rating, and then weighting that measure, creates a more robust metric of a school’s success in providing equitable education.
These gap measures are calculated for both ethnicity and income student groups separately. Similar to the average percentile for disadvantaged groups, all student groups which comprise 5% or more of enrollment are included for a school.
The first step in this process is the creation, at the school/outcome/grade/subject level, of student group percentile differences, just as we do in the first step of identifying disadvantaged groups. At the outcome/grade/subject level, any school data without at least one disadvantaged group and one non-disadvantaged group is not used. Each school’s data is then subsetted to include only gaps between disadvantaged student groups and non-disadvantaged groups. Then, the state average gaps are subtracted from the gaps observed at the school to get differences between gaps in the school and gaps in the state. Finally, weights are calculated to give schools more credit for closing performance gaps which are larger at the state level. The weights are calculated by dividing the absolute value of state-level gaps between each disadvantaged and non-disadvantaged group by the sum of those gaps. To apply the weights to the school/grade/subject level data, the weights are pared down to the corresponding student groups and normalized so that the weights sum to 1. The weights are multiplied by the difference from the state average, and then the average is calculated. This value is the gap score for the school/outcome/grade/subject level. The process is identical for income gaps, but no weights are used because only one disadvantaged and one non-disadvantaged student group exist.
The gap score at the school/outcome/grade/subject level is the average difference in percentile gaps across pairs of disadvantaged and non-disadvantaged student groups, weighted by the size of the state-level percentile gap relative to other state-level percentile gaps. Keeping income and ethnicity separate, the average across outcome/grade/subject levels is calculated for each school.
Given that several ethnicity groups exist compared to only two income groups, the distributions of ethnicity gap scores and income gap scores can be quite different. To account for this difference, gap scores are standardized by being converted to a z-score with a mean of 1. The average of the ethnicity z-score and income z-score is the school’s combined gap score. To be used as a weight, the gap score cannot have negative values and should be centered at a value of 1. Therefore, to calculate the gap weight, the combined gap score is converted to a percentile, and a value of 0.5 is added, which creates a midpoint of 1, preserving all other aspects of the distribution. Any school without a gap score (for example, a school serving only disadvantaged groups and therefore not having any applicable gaps) is assigned a gap weight of 1. This process results in a measure giving schools which have performance gaps smaller than the state average a gap weight greater than 1, schools with larger gaps a gap weight less than 1, and schools with gaps equal to the state average, or those serving only disadvantaged student groups a gap weight of exactly 1.
4. Computing the Equity rating
Taking the product of the disadvantaged student group performance component computed in step 2 above and the gap-weight computed in step 3, for each school gives us our equity score. To compute the Equity Rating, the equity score is then converted into a 1–10 rating, where a ‘1’ is assigned any number between 0 and 0.09, a ‘2’ is assigned any number between 0.10 and 0.19, and so on. It is possible for a high-performing school with smaller than average gaps to receive a value greater than 10, and in this case, the school receives an Equity Rating of 10.
Equity Ratings are calculated at the school level, for every school with sufficient available data. If a school has outcomes data but does not have outcomes data for any disadvantaged student groups, the school does not receive an Equity Rating.
Test Score Rating
The GreatSchools Test Score Rating is computed based upon the percent of students scoring proficient or above on their state’s standardized assessment in each grade and subject. This process includes the computation of both overall school-level Test Score Ratings and Test Score Ratings for groups of students within each school.
School Test Score Rating
The school Test Score Rating is calculated by first computing a standardized proficiency rate for each school in a state. To do this, we compute the school’s position in each grade/subject distribution as a percentile. Each percentile is calculated by comparing a school’s score for each grade/subject (eg. 4th grade Math, 10th grade Science) to the distribution of scores from all other schools in the state on that same grade/subject test. For example, an elementary school’s rating might be an average of six percentiles (student assessment scores from 3rd, 4th, and 5th grades, in both English and Math). The school’s 3rd grade English percentile would be determined by comparing the school’s score to all other 3rd grade English scores in the state and finding the percentile value.
The average of all data available for a school yields an average percentile ranking for a school’s proficiency rates across grades and subjects. This average is computed using weights to avoid over- or under-representation by any small N grades or subjects that may be present at a school. For most schools, the tests taken are relatively evenly distributed across grades and subjects; however, in order to account for cases in which a small group of remedial, or advanced, students are taking an above or below grade level test, or cases in which a specific grade represents a very small proportion of a particular school’s student body, we weight each subject/grade percentile by the number of students tested when computing the average. When data for the number of students tested is not available, or the proportion of school/grade/subject records with missing values for the number tested is greater than 0.5, the average percentile defaults to an equally-weighted average.
Once we have this weighted average percentile, we check to make sure the school has at least one English and one Math test represented in their average. For those schools that do have at least one English and one Math test, we assign schools a 1-10 value based upon their average percentile (across grade/subject), with averages between the 1st and 9th percentiles receiving a “1”, those between the 10th and 19th percentiles receiving a “2”, and so on until schools averaging between the 90th and 99th percentiles, which receive a “10”.
School Student Group Test Score Rating
To compute student group ratings, GreatSchools compares the performance of each group’s grade/subject in a given school to the performance of all students in the state. For each grade/subject GreatSchools compares the performance (% proficient and above) of students in each group at a school to the distribution of performance of all students in the state in that grade/subject, locating where the performance of these students falls in the overall distribution as a percentile. We then average across these grade/subject percentiles for each student group to arrive at an average percentile across grades and subjects for each student group in a school.
Once we have the weighted average student group percentile, we check to make sure the school has at least one English and one Math test represented in their average. For those schools that do have at least one English and one Math test, we assign each school a student group rating by binning average percentiles in the same method used with the overall Test Score Rating.