About GreatSchools.org’s ratings
As an independent nonprofit, our mission at GreatSchools.org is to help all parents get a great education for their children and for communities to ensure that all students get the support they need to succeed. The definition of “success” is as diverse as the millions of parents who visit our site each year, and we strive to display a variety of indicators of school quality to provide a well-rounded picture of how effectively each school serves its students. We understand that the available information doesn’t always reflect parents’ priorities. That’s why we are constantly working to acquire a broader range of information in order to paint a richer picture of school quality and what it means to provide equitable opportunity for all students.
In 2017, we launched our Summary Rating, which is comprised of themed ratings that each reflect important factors in how students experience school, including how well schools serve students from different racial, ethnic, and socioeconomic backgrounds, how much students are improving within a school year, performance on state tests, and how well schools prepare students for college.
In August 2020, we piloted new methodologies in California and Michigan for both the Summary Rating and the Equity Rating to provide a clearer lens to see how schools serve all children. This new methodology was available nationwide as of September, 2020.

Our approach to ratings
We believe that every parent — regardless of their background — needs reliable information in order to understand whether their child is being served by their school. We recognize that how well a school serves students from historically marginalized populations goes beyond test scores. A mounting body of evidence suggests that in comparison to just end-of-year test scores, student progress — or growth — is a more accurate way to measure how much value a school is adding for its students. (Student progress, or growth, measures how much each child learns in a given year, based on the change in their state test scores from one year to the next.) This information, when used in combination with other information, such as college readiness measures and test score data, can give parents a better understanding of a school’s quality.
With this in mind, we have added student progress and college readiness metrics to our Equity Rating, and we have updated our overall Summary Rating methodology to emphasize student growth relative to test scores. These changes will help uncover the strengths of schools successfully serving Black, Latinx, Native American and low-income students. We believe this is an important step toward providing richer, multifaceted information that is not only based on research, but also reflective of what parents find meaningful.
How do our ratings work?
Summary Rating
The GreatSchools Summary Rating appears at the top of a school’s profile. Our ratings follow a 1-10 scale, where 10 is the highest and 1 is the lowest. Ratings at the lower end of the scale (1-4) signal that the school is “below average,” 5-6 indicate “average,” and 7-10 are “above average.”
The Summary Rating calculation is based on four ratings, each of which is designed to show different facets of school success: the Student Progress Rating or Academic Progress Rating, College Readiness Rating, Equity Rating, and Test Score Rating. The ratings for each school vary based on data availability or relevance to a school level (for example, high schools have a College Readiness Rating, but elementary schools do not). We do not produce Summary Ratings for schools if we lack sufficient data. For more about how this rating is calculated, see the Summary Rating inputs and weights section below.
Note: Some states do not have sufficient information to generate a Summary Rating. In these states, we default to the school’s Test Score Rating as the overall rating displayed at the top of the profile.
Student Progress Rating
The Student Progress Rating (also known as “growth”) measures whether students at a school are making academic progress over time. Specifically, the Student Progress Rating measures how much progress individual students have made on state standardized assessments during the past year or more and how this performance aligns with expected progress for that student. Each state department of education establishes a student growth model. The Student Progress Rating shows how this school’s average growth data compares to growth data of other schools in the state. The goal of the Student Progress Rating is to provide transparency into schools that are improving student outcomes regardless of the student’s starting point in terms of academic achievement.
Student Progress data is less common for high schools, because in many states high school students only take state standardized tests in one year. It is also important to note that it is possible for schools with already-high-performing students to receive a high Student Progress Rating, or for schools with high test scores to receive a low Student Progress Rating. Research indicates that growth metrics are a more accurate measure of the value that a school adds for its students because they are less correlated with the socioeconomic background of the student population than test score performance. In the Summary Rating, we give more weight to the Student Progress Rating than the Test Score Rating. See the Summary Rating inputs & weights section below for more information about how this rating is calculated.
For more information about how we calculate this rating, see the GreatSchools Ratings methodology report.
Academic Progress Rating
For states that do not provide publicly available growth data which meets our requirements for a growth rating, we calculate an Academic Progress Rating, a proxy rating based on a model using school-level data instead of student-level data. This data is less common for high schools, since in many states high school students only take state standardized tests in one year, making it difficult to look at grade-to-grade improvement. When usable student growth data become publicly available in these states, we will replace the Academic Progress Rating with a Student Progress Rating. In response to low testing rates in the 2019-20 and 2020-21 school years, we temporarily adjusted our Academic Progress Rating Methodology based on recommendations from education research groups and policymakers.
For more information about how we calculate this rating, see the GreatSchools Ratings methodology report.
College Readiness Rating
The College Readiness Rating is designed to measure how well high schools prepare their students for success in college and career, compared to other schools in the state. The rating is based on the high school’s graduation rate, data about college entrance exams (SAT/ACT performance) and/or advanced course information, including enrollment in International Baccalaureate courses, dual-enrollment courses, and Advanced Placement (AP) courses and AP exam passing rates. This rating only applies to high schools.
For more information about how we calculate this rating, see the GreatSchools Ratings methodology report.
Equity Rating
The Equity Rating is designed to measure how well a school serves the academic development of disadvantaged student groups. The rating includes data on 1) how disadvantaged students are performing based on student progress (growth) or academic progress (growth proxy), college readiness (e.g., college entrance exam performance and high school graduation rates), and state proficiency tests, in comparison to the outcomes for all students in the state, and 2) performance gaps between disadvantaged students and non-disadvantaged students in a school. We define disadvantaged students as students from racial, ethnic, and/or socioeconomic groups that show persistent gaps across all schools and outcomes within the state. This allows us to understand how well the school is educating disadvantaged student groups compared to all students, and how these students are performing compared to non-disadvantaged students in each school. A low rating (1–4) may indicate some student groups are not getting the support they need at the school, while a high rating (7–10) may indicate that a school’s disadvantaged groups are doing well.
When the population of a student group is too small to provide reliable data (less than 5% of the total student body), that student group is omitted from the calculation. As a result, some groups may not be included in some charts within the equity sections of the school’s profile.
Some schools do not have a large enough population of disadvantaged students to calculate an Equity Rating (homogeneous schools). These schools do not receive an Equity Rating. Their Summary Rating is therefore composed of the other available data.
For more information about how we calculate this rating, see the GreatSchools Ratings methodology report.
Test Score Rating
The Test Score Rating measures schools on academic proficiency, using performance on state tests (the percentage of students scoring at or above proficiency) across grades and subjects, compared to other schools in the state, to produce a 1-10 rating for each school. This school’s overall Test Score Ratings are displayed in the Academics section on school profiles and are broken out by student group (race/ethnicity and family income) in the Equity section. This rating is an important factor in understanding school quality because it helps reflect how well students are meeting academic proficiency standards set by each state.
For more information about how we calculate this rating, see the GreatSchools Ratings methodology report.
Note: we also display discipline and attendance flags to identify schools with worrisome patterns of out-of-school suspensions and chronic student absenteeism. Creating these flags involves two primary steps: identifying schools with high rates of suspension or absenteeism, and identifying schools with significant differences in suspension or chronic absenteeism rates between students from different race/ethnicity groups. If a school has a flag, it appears in a school’s “Equity” section, under “Race/ethnicity” then toggle to view the “Discipline & attendance” information. These flags do not influence any of the themed ratings or the Summary Rating.
Summary Rating inputs and weights
The Summary Rating calculation is based on up to four of the school’s themed ratings (described above), based on available data. For example, college readiness measures like Advanced Placement classes and college entrance exams are available in most high schools but not elementary or middle schools.
To calculate the Summary Rating, we use weights for each themed rating based on the available data, the amount of information available about the school relative to other schools in the state, the amount of variability in the data, and the extent to which each data point has been proven to be related to student success in college and for long-term life outcomes. The maximum weight for each themed rating is capped to be no more than the Student Progress/Academic Progress Rating weight, regardless of its data availability and quality.
Below are representative examples of how a high school or elementary school’s ratings are weighted within the overall Summary Rating calculation for the school:
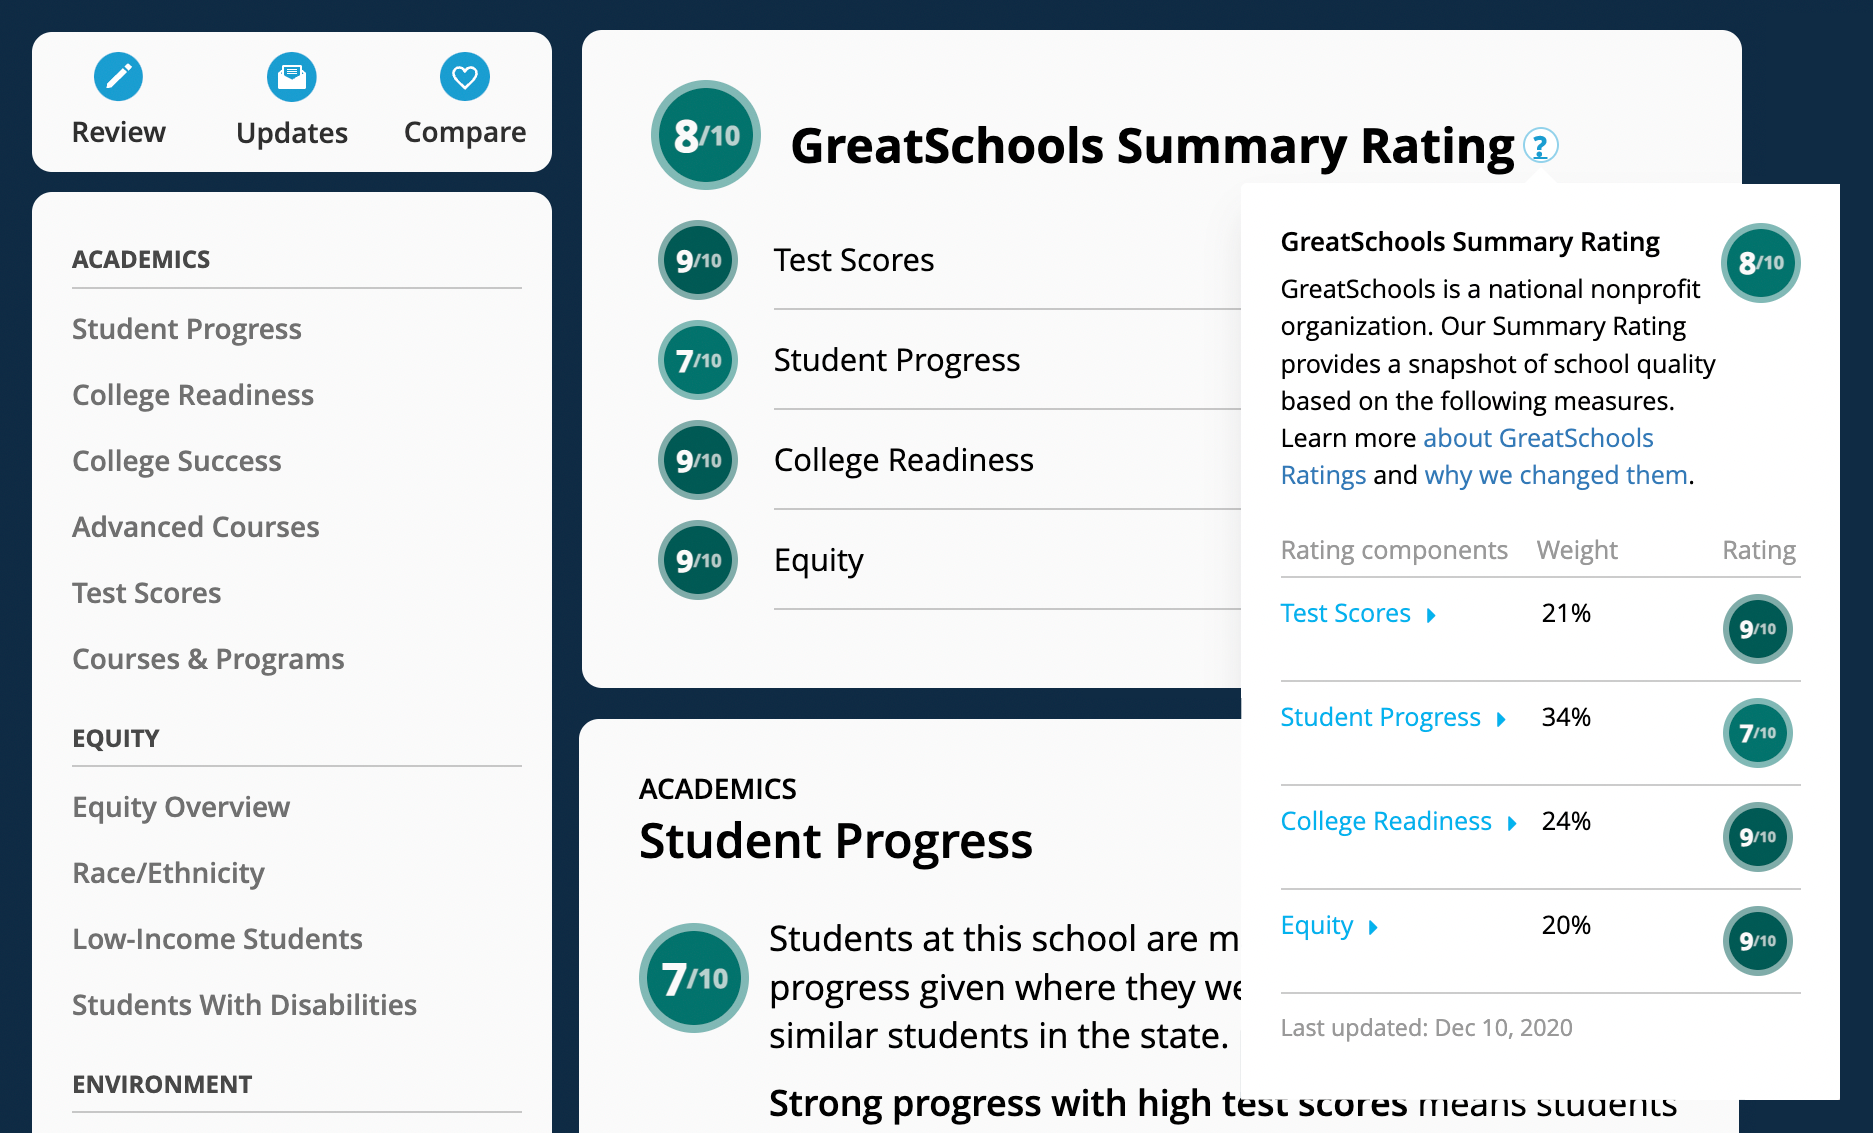
Inputs to the Summary Rating are school- and state-specific, depending on data availability. Each of the themed ratings that comprise the Summary Rating may be refreshed as new data becomes available, which in turn may cause the school’s Summary Rating to change. These changes may happen at different times throughout the course of a year. To see when underlying data was updated, click on the Sources information for each rating and flag. Note: rounding of percentages may cause some Summary Rating weights to exceed 100%.
Greater data transparency
At GreatSchools.org, we believe that transparency builds trust. We believe that government education agencies have an obligation to make data on school quality available to parents and the public. Every parent should feel informed and empowered to unlock educational opportunities for their child regardless of their family background. That’s why in recent years, GreatSchools.org has expanded data collection efforts in every state to include various types of school quality data broken down by student groups, including students from low-income families, diverse racial and ethnic backgrounds, and students with disabilities. These additional data (where available) are now part of GreatSchools.org school profiles and provide a more complete picture of how effectively a school serves all of its students.
Data transparency helps parents know how schools in their community are doing, where there is room for improvement, and what the best options are for their children. Sharing school information — good and bad — also cultivates parent engagement and trust. Additionally, it’s important that school data be made available in accessible, easy-to-use formats so that non-governmental organizations can use the information to inform parents and students about the quality of their local schools.
Our ongoing commitment to offering a broader view of school quality
We are committed to an ongoing evolution of how we can paint a broader picture of school quality that better captures the factors that matter most to parents and that research shows can make a difference in student success. We think the changes we are making to our methodology are a step forward in our ongoing mission to illuminate issues around equity in education. Going forward, we will continue to work in collaboration with research partners and to pursue an expanded definition of school quality that includes information about the resources, opportunities, and practices used in schools, and meaningful outcomes for all students. We will continue to advocate for the quality and types of data needed to help parents understand how schools are doing in their state. Where data is not available, we’ll continue to highlight the need for, and value of, transparency, as we have done for years.
Support and frequently asked questions
- Was this information helpful in better understanding our ratings? Share your feedback.
- For additional help, please visit our FAQ page.
- For more information on GreatSchools’ commitment to working with government education agencies and community partners to provide better information on student outcomes, please contact us.